ESC
Genomics & Transcriptomics

Next-Generation Sequencing

Bulk and single-cell RNA-seq are central pillars of my work, used in parallel with imaging and biochemistry to define how disease genotypes — especially PARK2/Parkin, SNCA, and immune-stress states — reshape cellular programs in iPSC-derived neurons, cardiomyocytes, and other lineages. Below is an integrated end-to-end example drawn from my recent preprint on Parkin and the small-molecule Parkin agonist FB231, illustrating how I combine differential expression, GSEA, transcription-factor inference (DecoupleR), and single-cell clustering to dissect cell-state changes.

NPC Phenotyping Bulk RNA-seq scRNA-seq In Vivo Validation FB231 Rescue iPSC Models
01

From Sample to Biology — A Reproducible NGS Workflow

For every iPSC-based study, I run a standardized pipeline: total-RNA extraction (Qiagen RNeasy or Trizol — QC by Bioanalyzer RIN ≥ 8), library prep (Illumina Stranded mRNA or 10x Chromium v3), sequencing (NovaSeq 6000 or NextSeq 2000), and analysis with STAR/Salmon → DESeq2 / edgeR (bulk) or Cell Ranger → Seurat / Scanpy (scRNA-seq). Pathway analysis layers on GSEA (fgsea, MSigDB Hallmark/KEGG/Reactome) and transcription-factor activity inference with DecoupleR. All findings are cross-validated by qPCR, Western, and imaging.

NGS Pipeline
Sample → Library → Sequencing → Processing → Biology
01 · Sample
RNA Isolation
RNeasy / Trizol
QC by Bioanalyzer; aim for RIN ≥ 8 before submitting libraries.

For bulk: Qiagen RNeasy Mini with on-column DNase or Trizol phase separation. For single-cell: dissociate to single-cell suspension with viability >85%. QC by Bioanalyzer/TapeStation; reject samples with RIN < 7.

02 · Library
Prep & QC
Illumina Stranded mRNA · 10x Chromium v3
Bulk libraries via stranded mRNA; single-cell libraries via 10x Chromium v3.

Bulk: Illumina Stranded mRNA with poly-A selection or NEBNext rRNA-depleted. Single-cell: 10x Chromium Single Cell 3' v3.1. Validate library size on TapeStation; quantify by Qubit/qPCR before pooling.

03 · Sequence
NovaSeq / NextSeq
PE150 · 30–50M reads / sample
Two technical replicates per condition; demultiplex with bcl2fastq / Cell Ranger mkfastq.

Bulk: PE150, ~30 M reads/sample minimum (more for low-expressed genes). Single-cell: PE150 with 10x indexing, ~20–50k reads/cell.

04 · Process
Align & Quantify
STAR / Salmon · Cell Ranger
Bulk: STAR / Salmon → DESeq2 / edgeR. Single-cell: Cell Ranger → Seurat / Scanpy + Harmony.

Bulk: STAR against GRCh38 or Salmon for rapid quasi-mapping; quantify counts → DESeq2 / edgeR. Single-cell: Cell RangerSeurat v5 or Scanpy + Harmony batch correction.

05 · Biology
Pathway & TF
GSEA · KEGG · Reactome
fgsea against MSigDB Hallmark/KEGG/GOBP; DecoupleR TF activity over CollecTRI / DoRothEA regulons.

fgsea against MSigDB Hallmark, KEGG, GOBP, Reactome with 1k–10k permutations (NES > |1.5|, FDR < 0.05). DecoupleR with CollecTRI / DoRothEA regulons for TF activity.
Bulk + sc
complementary readouts
DESeq2
DE · FDR < 0.05, |log₂FC| > 1
fgsea
Hallmark / KEGG / GOBP
DecoupleR
TF activity inference
02

Lineage QC — PARK2 KO Neural Progenitors

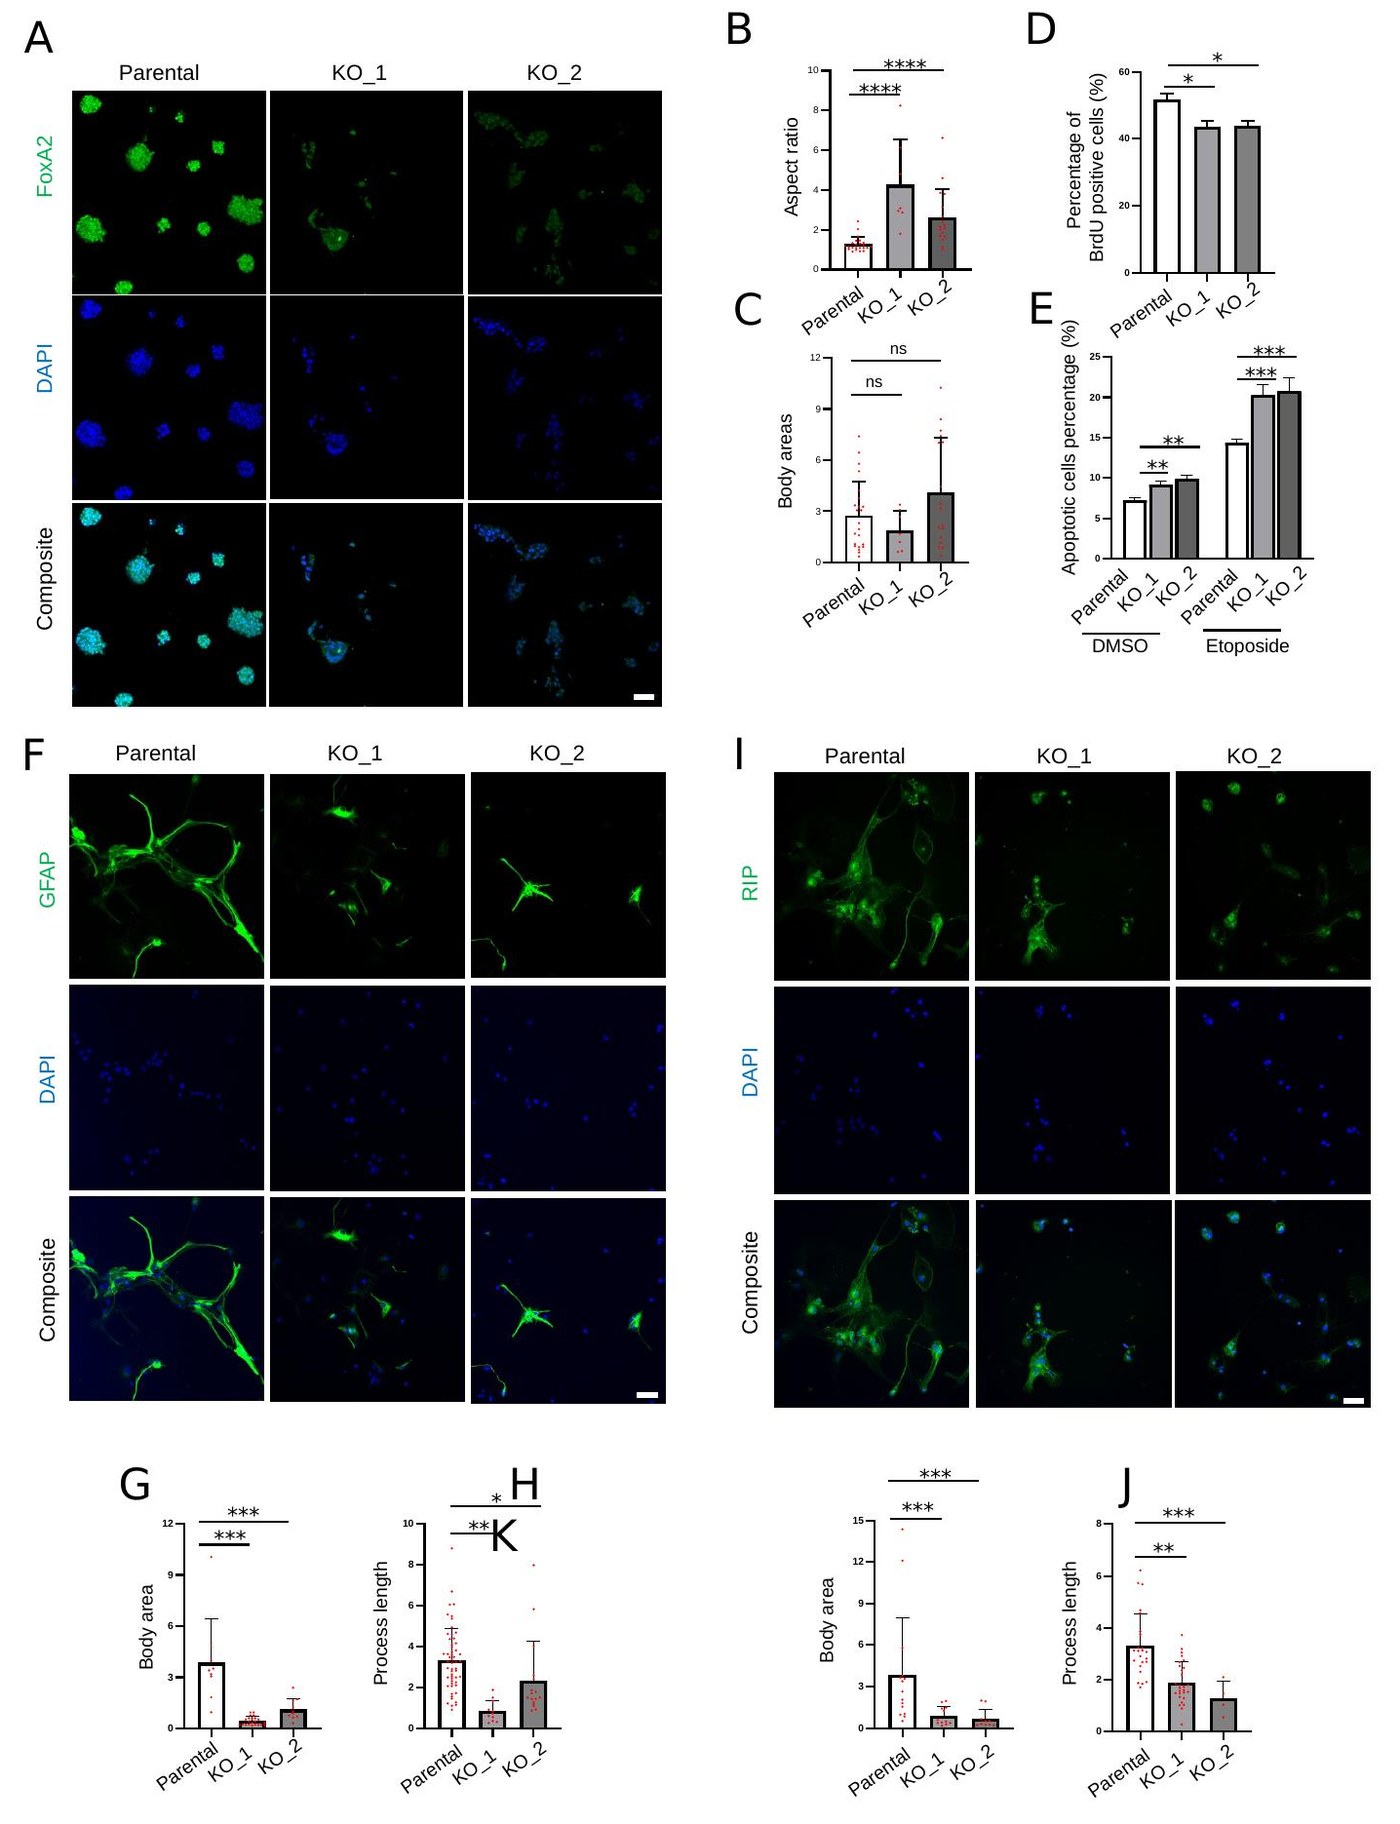
Before any sequencing, isogenic CRISPR PARK2 KO and parental neural progenitor cells (NPCs) are validated by FOXA2, GFAP, and RIP immunofluorescence; cell-cycle (BrdU), apoptosis (DMSO/etoposide), aspect ratio, body area, and process length quantification confirm the morphological phenotype that the transcriptomics will then resolve at gene-level resolution.

Figure S1 - NPC immunofluorescence and morphological quantification
NPC characterization. FOXA2 (panel a) and apoptosis / proliferation (b–e) for parental and two PARK2 KO clones. GFAP (f) and RIP (i) immunostaining with body-area and process-length quantification (g–h, j–k).
03

Bulk RNA-seq — PARK2 KO Reshapes the NPC Transcriptome

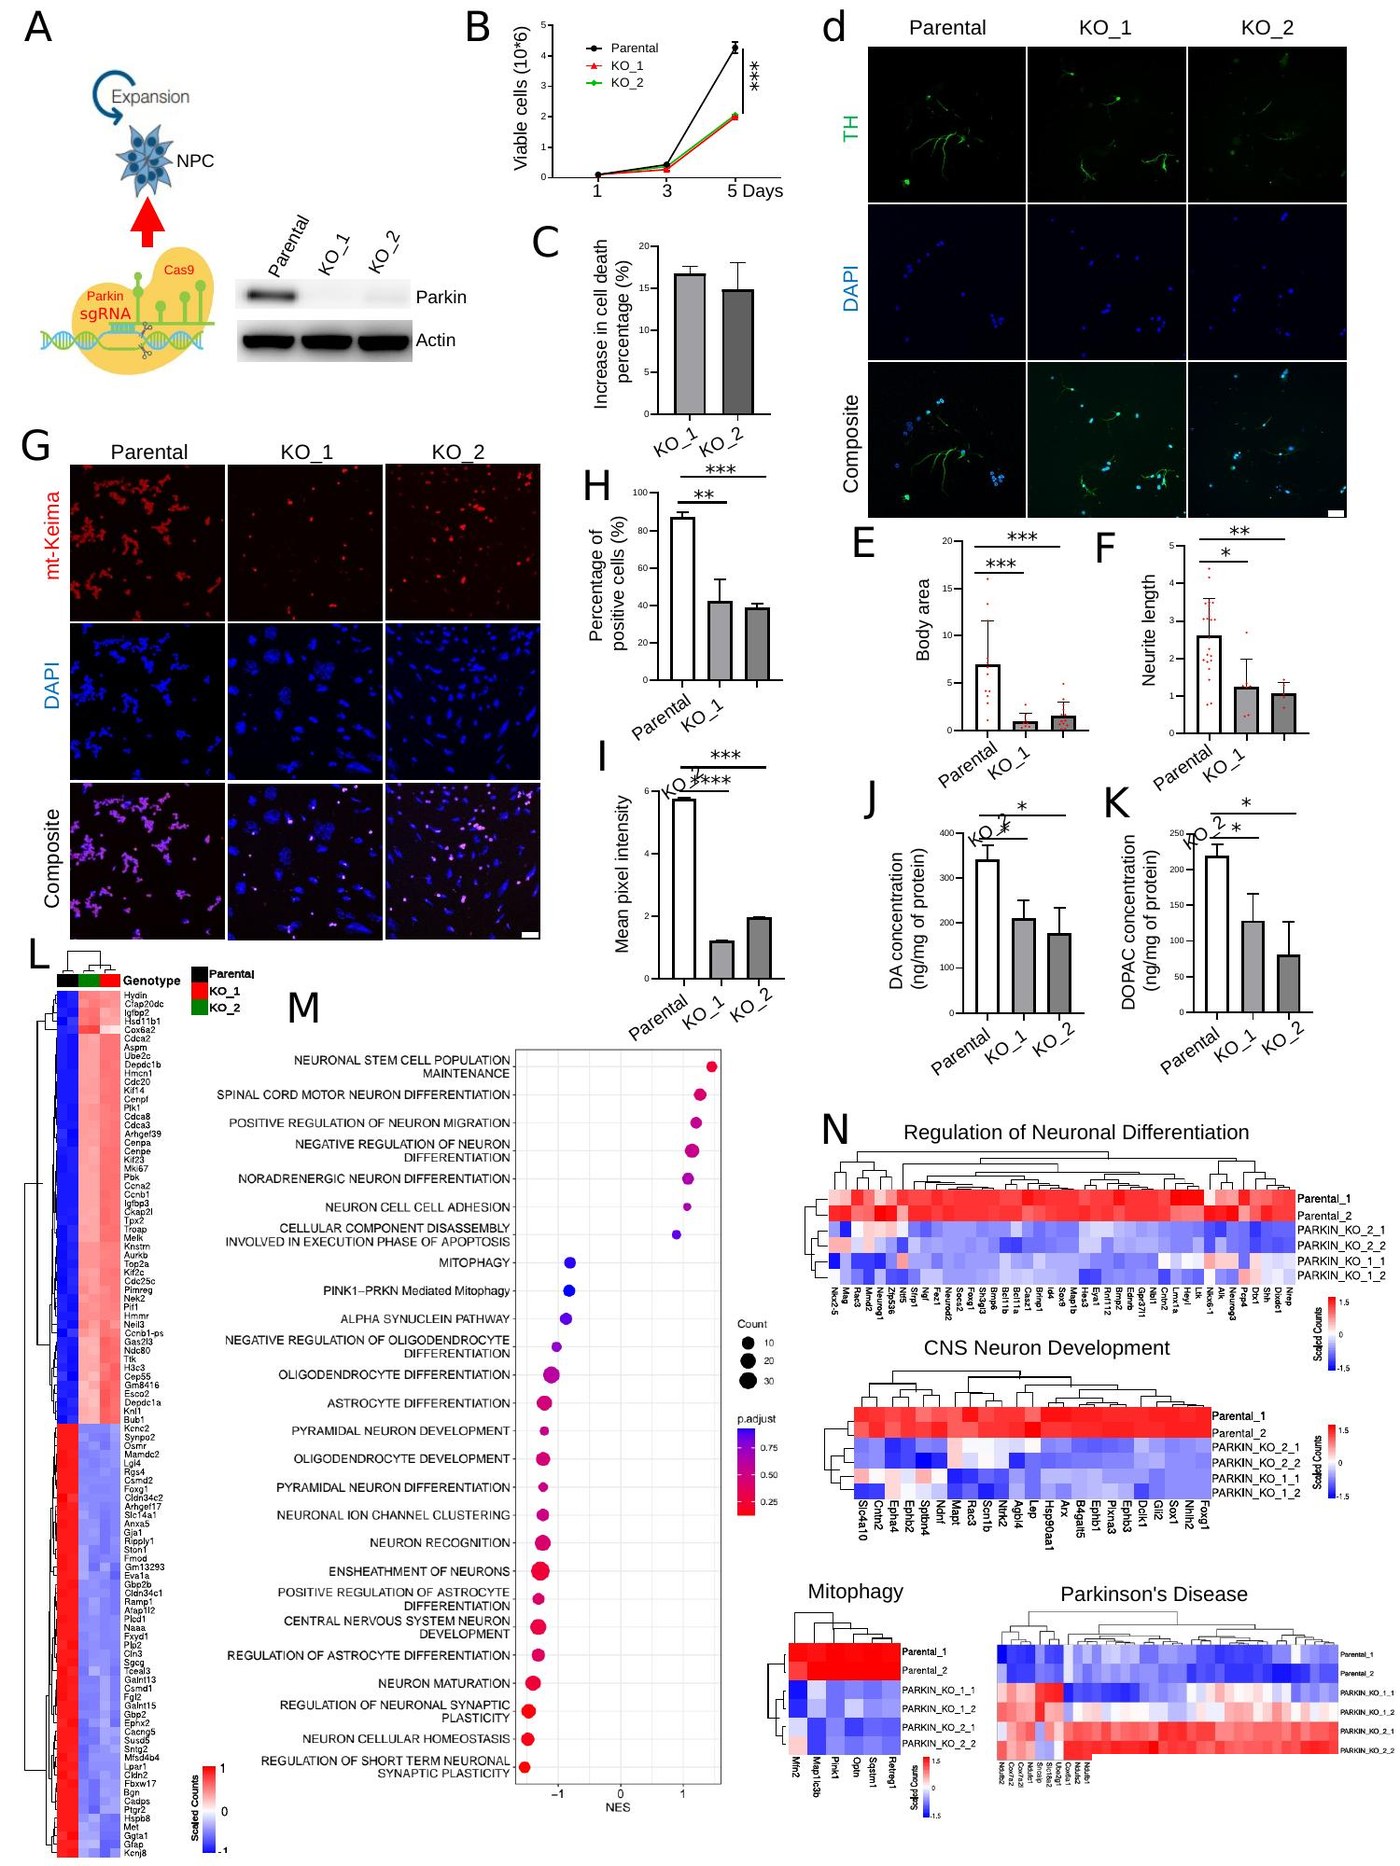
In iPSC-derived NPCs, CRISPR knockout of PARK2 caused widespread transcriptomic remodeling — 657 genes up- and 1,440 down-regulated. Down-regulated genes included regulators of mitochondrial function and neurogenesis (Gja1, Anxa5, Gfap, Osmr). GSEA showed broad suppression of neurogenesis, synaptic maintenance, and mitophagy with compensatory up-regulation of adhesion and stem-like programs — consistent with a shift toward an immature, stress-vulnerable state.

Figure 1 - Parkin KO NPC characterization, mitophagy, and bulk RNA-seq
Figure 1 — PARK2 KO NPCs and the bulk transcriptome. CRISPR knockout (a–c) decreases proliferation, increases cell death (b, c), reduces TH+ dopaminergic differentiation (d–f), and impairs mt-Keima mitophagy (g–k). Differential-expression heatmap (l), GSEA dot plot (m) and leading-edge heatmaps (n) for neuronal differentiation, CNS development, mitophagy, and Parkinson’s pathways.
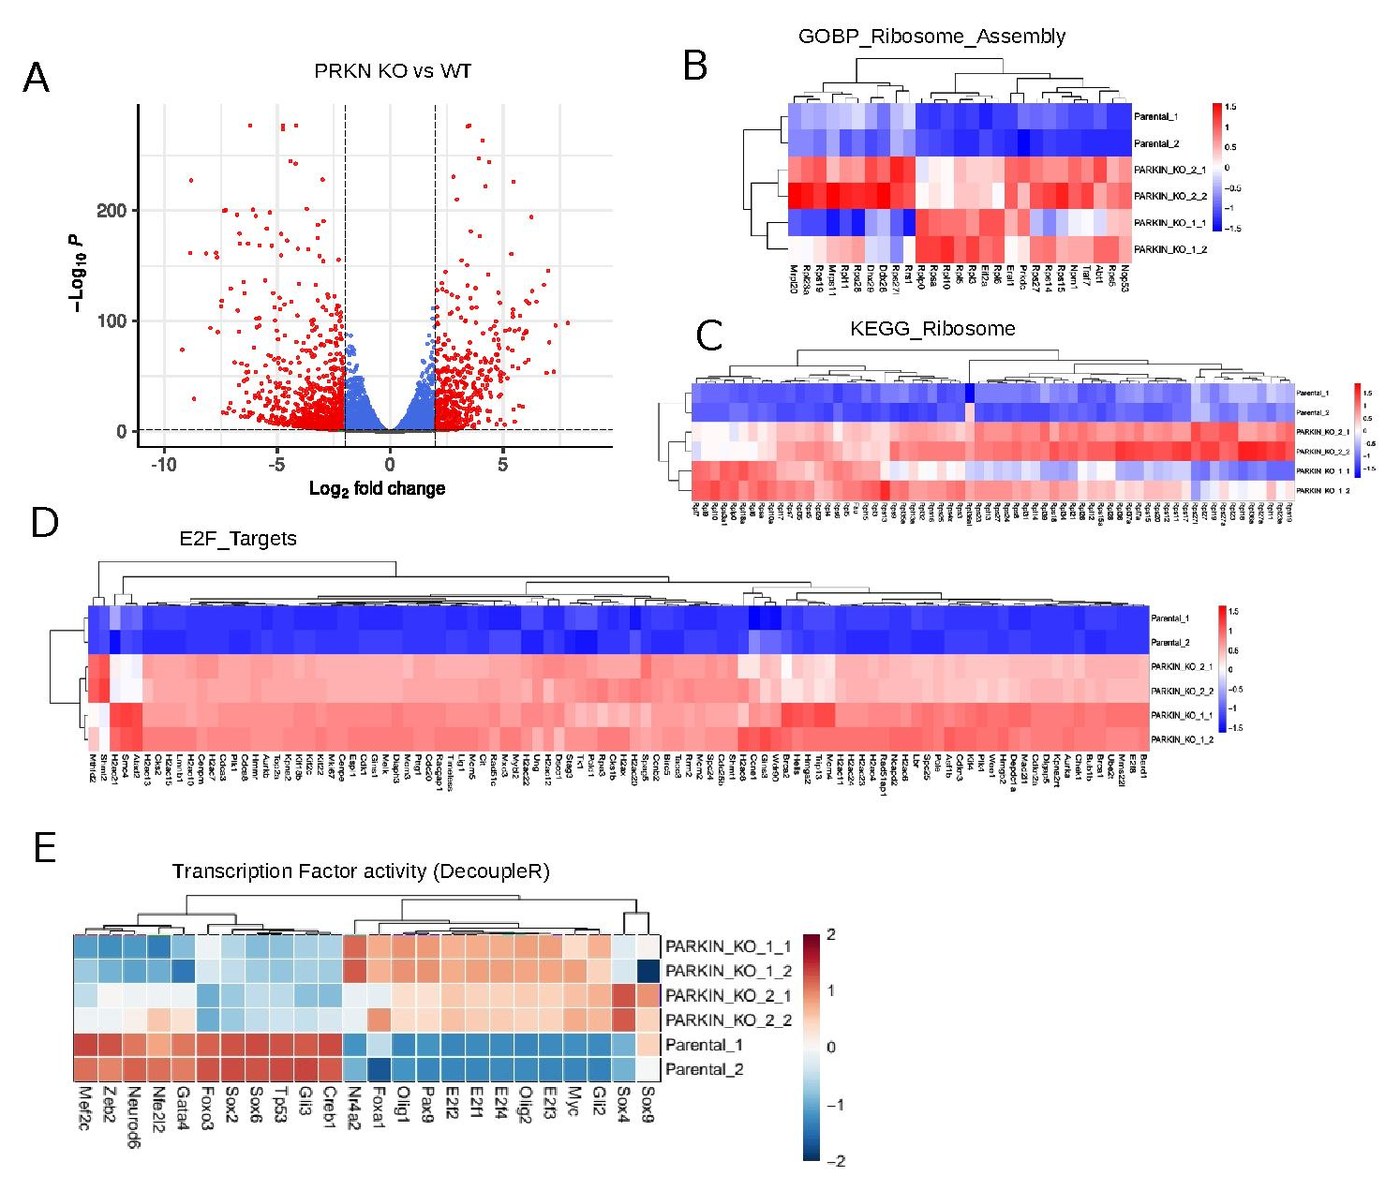
Supplementary Figure 2 - Volcano plot, GSEA heatmaps, DecoupleR TF activity
Volcano + GSEA + DecoupleR TF activity. Volcano plot (a) of DE genes (KO vs WT, |log₂FC| > 2, pₐ⁹⁸ < 0.05). Leading-edge heatmaps (b–d) for GOBP ribosome assembly, KEGG ribosome, and E2F targets. DecoupleR transcription-factor activity (e) across replicates highlights elevated Olig1/2 and reduced NeuroD2, Foxo3, Tp53, Gata4.
04

scRNA-seq — Cell-State Composition and Cell-Type-Specific Programs

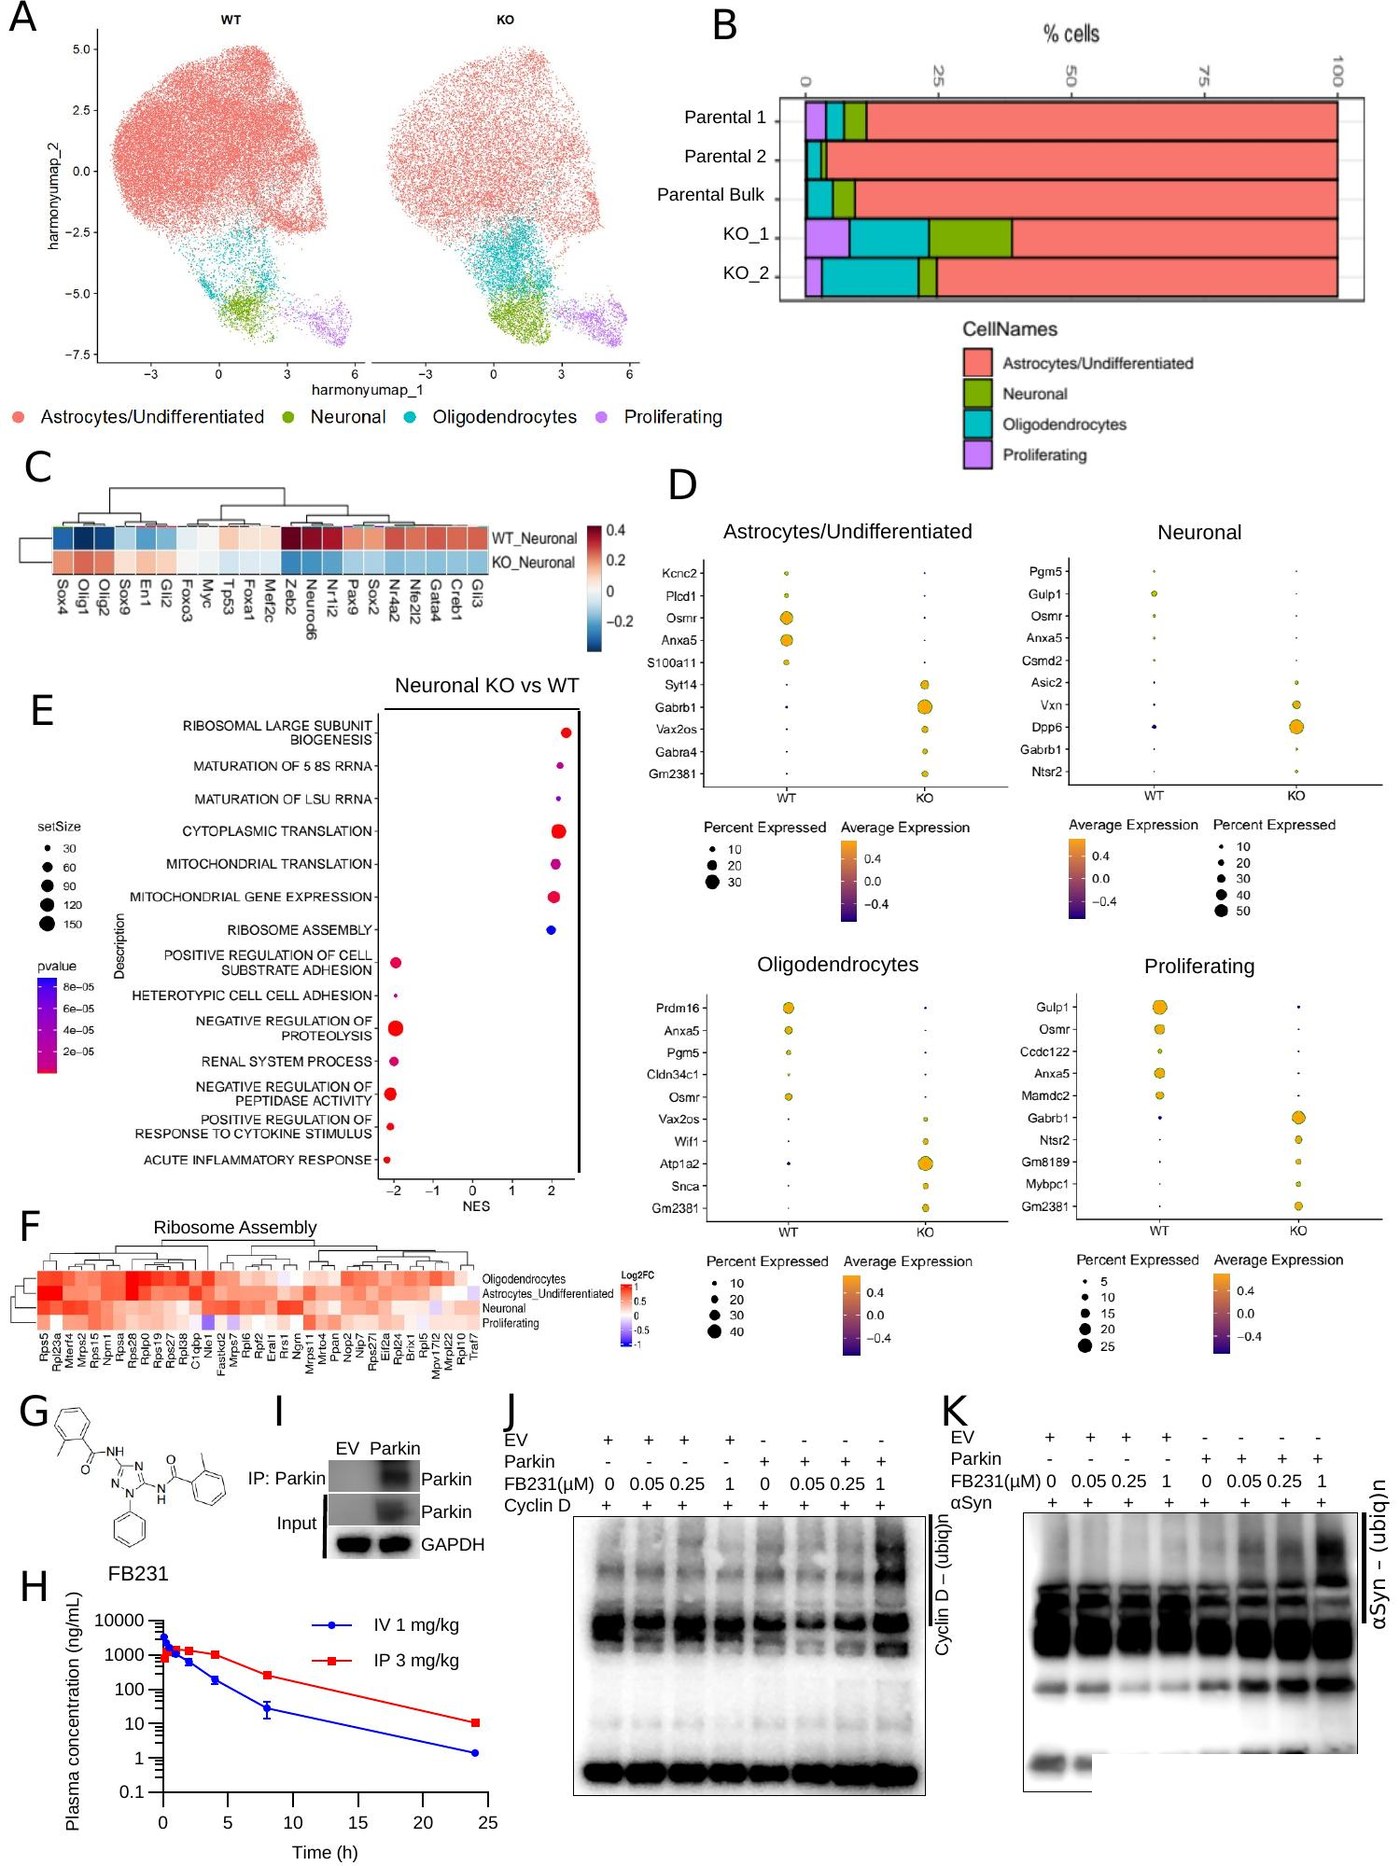
Single-cell sequencing of differentiated cultures resolved four major populations — neurons, astrocytes/undifferentiated cells, oligodendrocytes, and proliferating cells. PARK2 KO cultures showed expansion of the oligodendrocyte and proliferating compartments and relative loss of mature neurons. Cluster-level DecoupleR identified elevated immature/glial TFs (Olig1/2) and reduced neuronal regulators (Zeb2, Neurod6).

Figure 2 - scRNA-seq UMAP, composition, DecoupleR TF activity, and FB231 ubiquitination
Figure 2 — scRNA-seq + FB231 target engagement. Harmonized UMAP (a) and per-sample composition stacked bar (b). Cluster-level DecoupleR TFs (c) and lineage-specific DE dot plots (d). Functional GSEA (e–f) including ribosome assembly leading-edge heatmap (f). FB231 chemistry (g), PK profile (h), and Parkin-dependent ubiquitination of cyclin D1 (j) and α-synuclein (k).
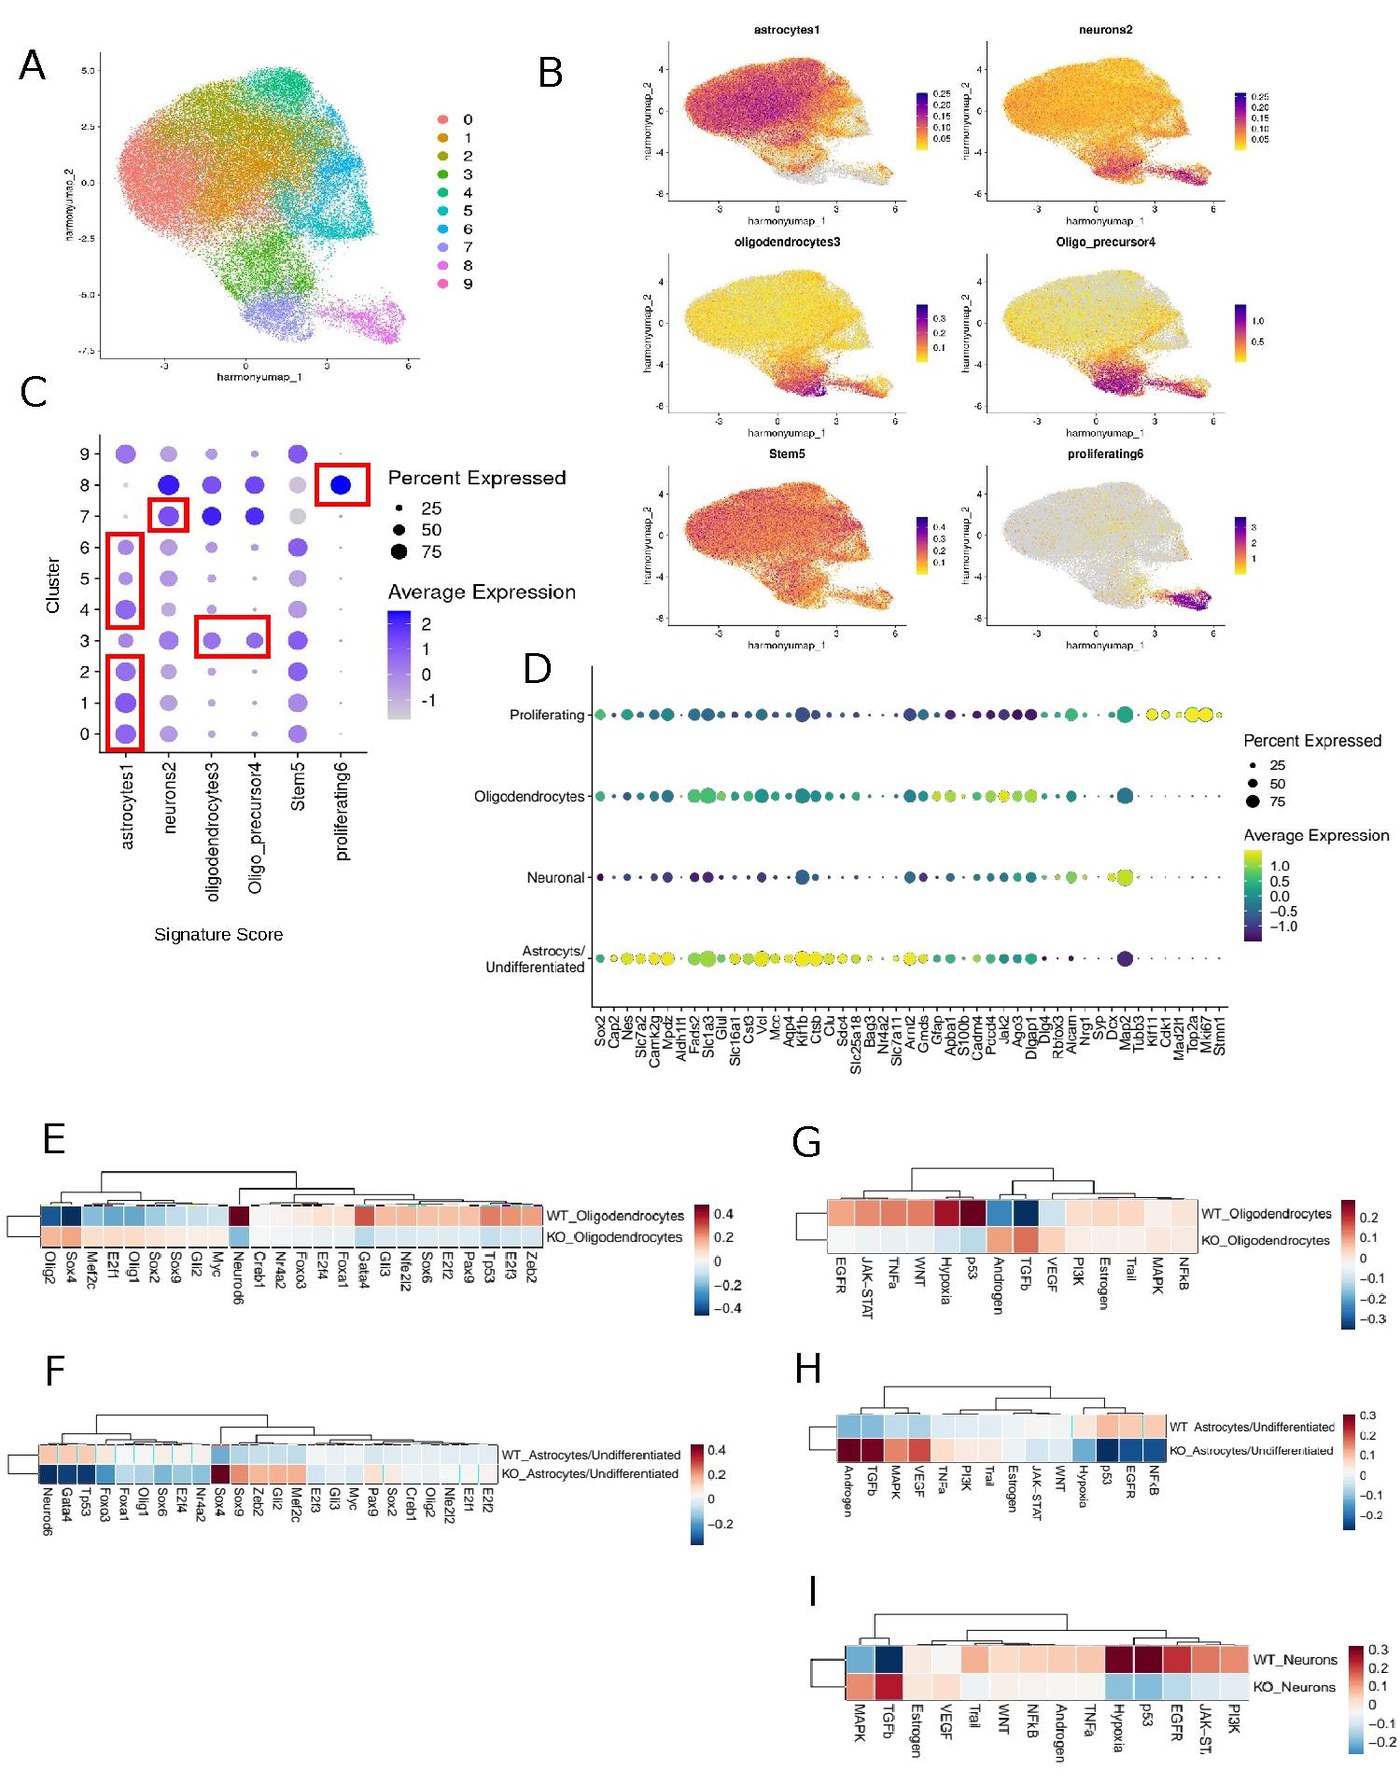
Supplementary Figure 3 - UMAP, feature plots, and lineage-specific DecoupleR heatmaps
Cluster identification & lineage-specific TFs. Ten Harmony-corrected clusters (a). AddModuleScore feature plots (b) for astrocyte, neuron, oligodendrocyte, OPC, stem, and proliferating signatures. Dot plots (c–d) summarize cluster-defining genes. DecoupleR TF activity heatmaps split by cell type (e–i).
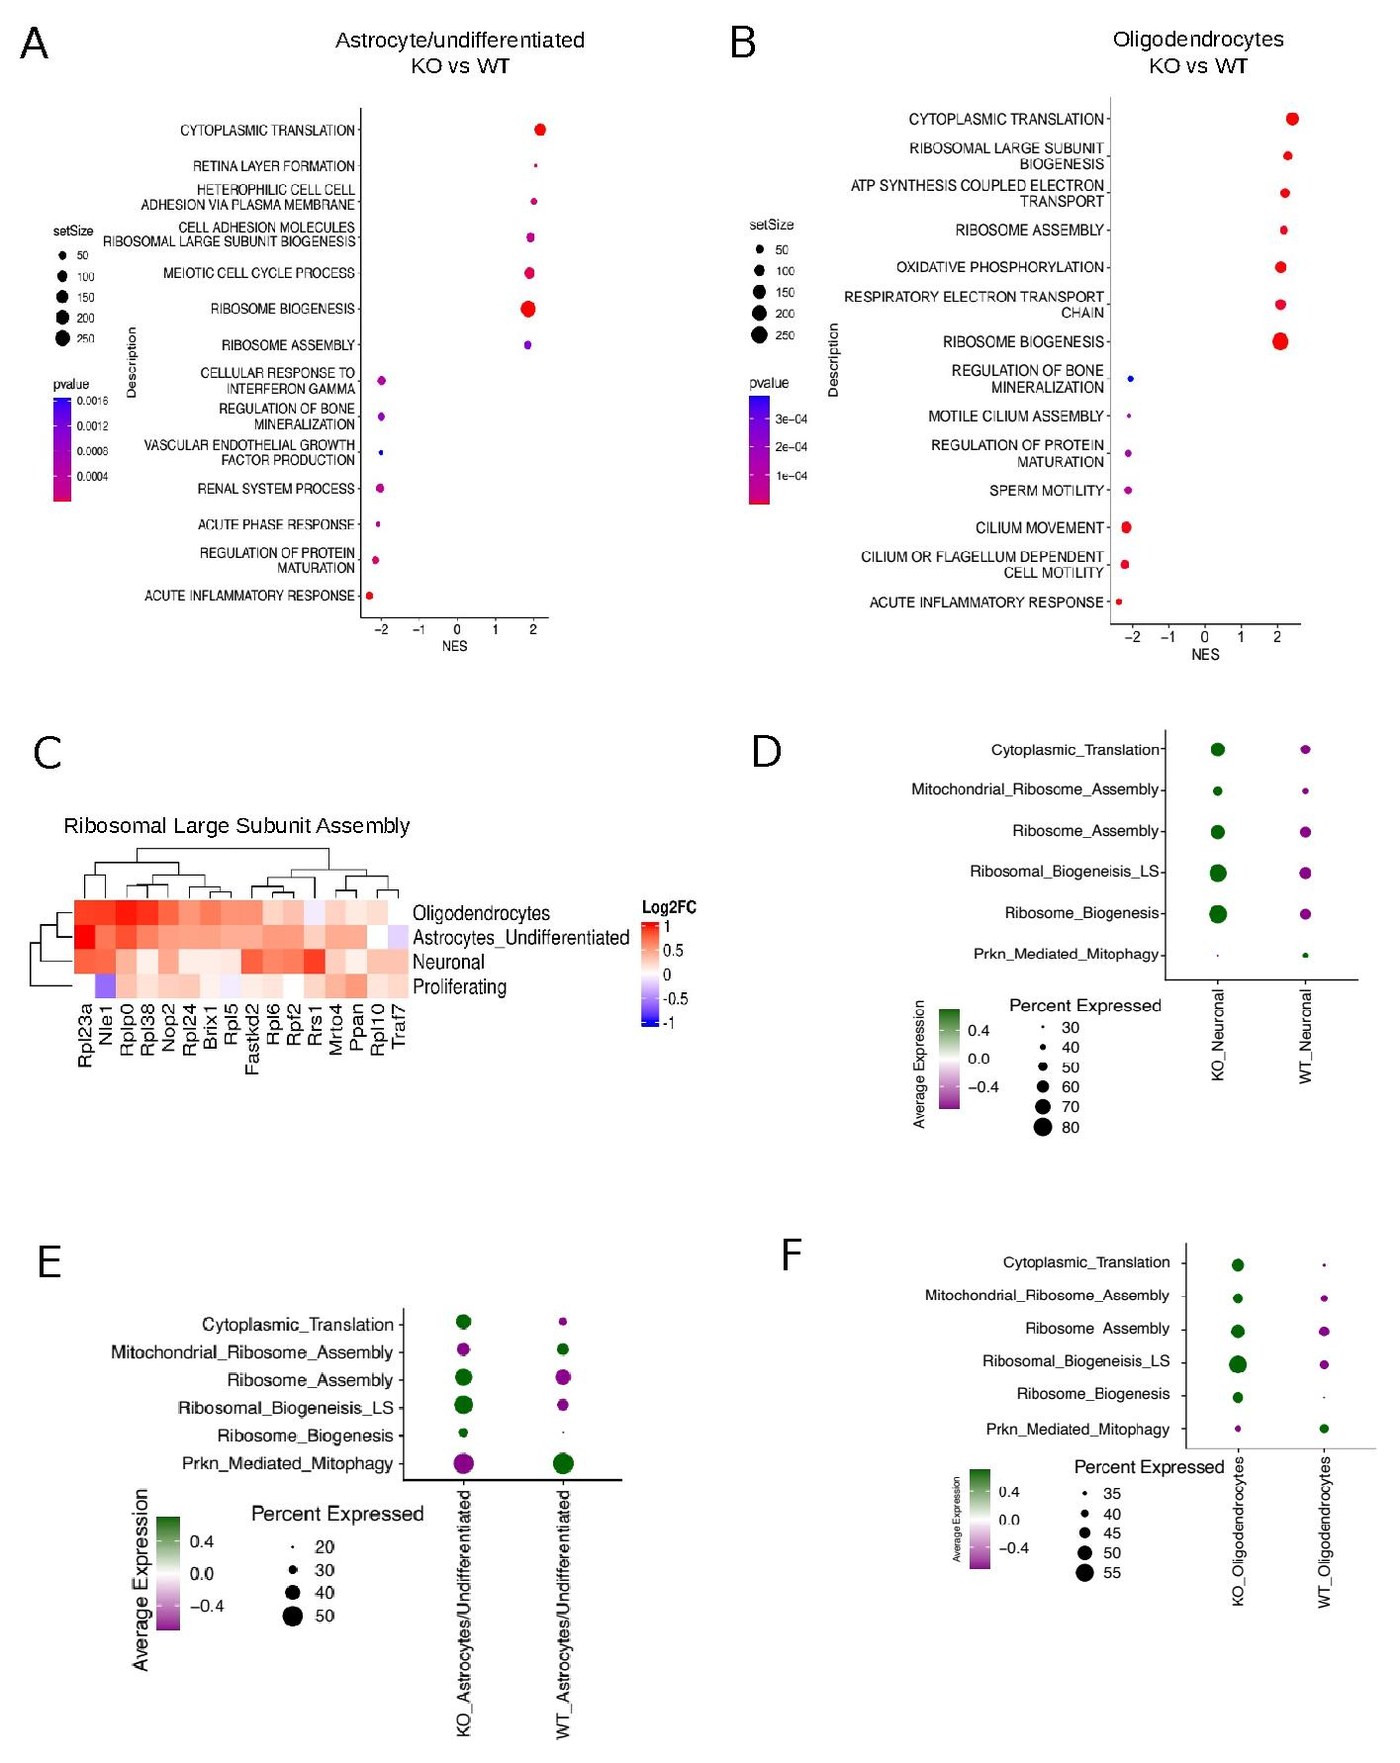
Supplementary Figure 4 - per-cell-type GSEA and translation/mitophagy module scoring
Per-cell-type GSEA & module scoring. NES dot plots for astrocyte (a) and oligodendrocyte (b) populations. Ribosomal large-subunit assembly leading-edge heatmap (c). Module scoring across cell types for translation, ribosome assembly, biogenesis, and Prkn-mediated mitophagy (d–f) confirms heightened ribosome activity and diminished mitophagy in PARK2 KO cells.
05

From Cells to Animals — FB231 in a Gut α-Synuclein Model

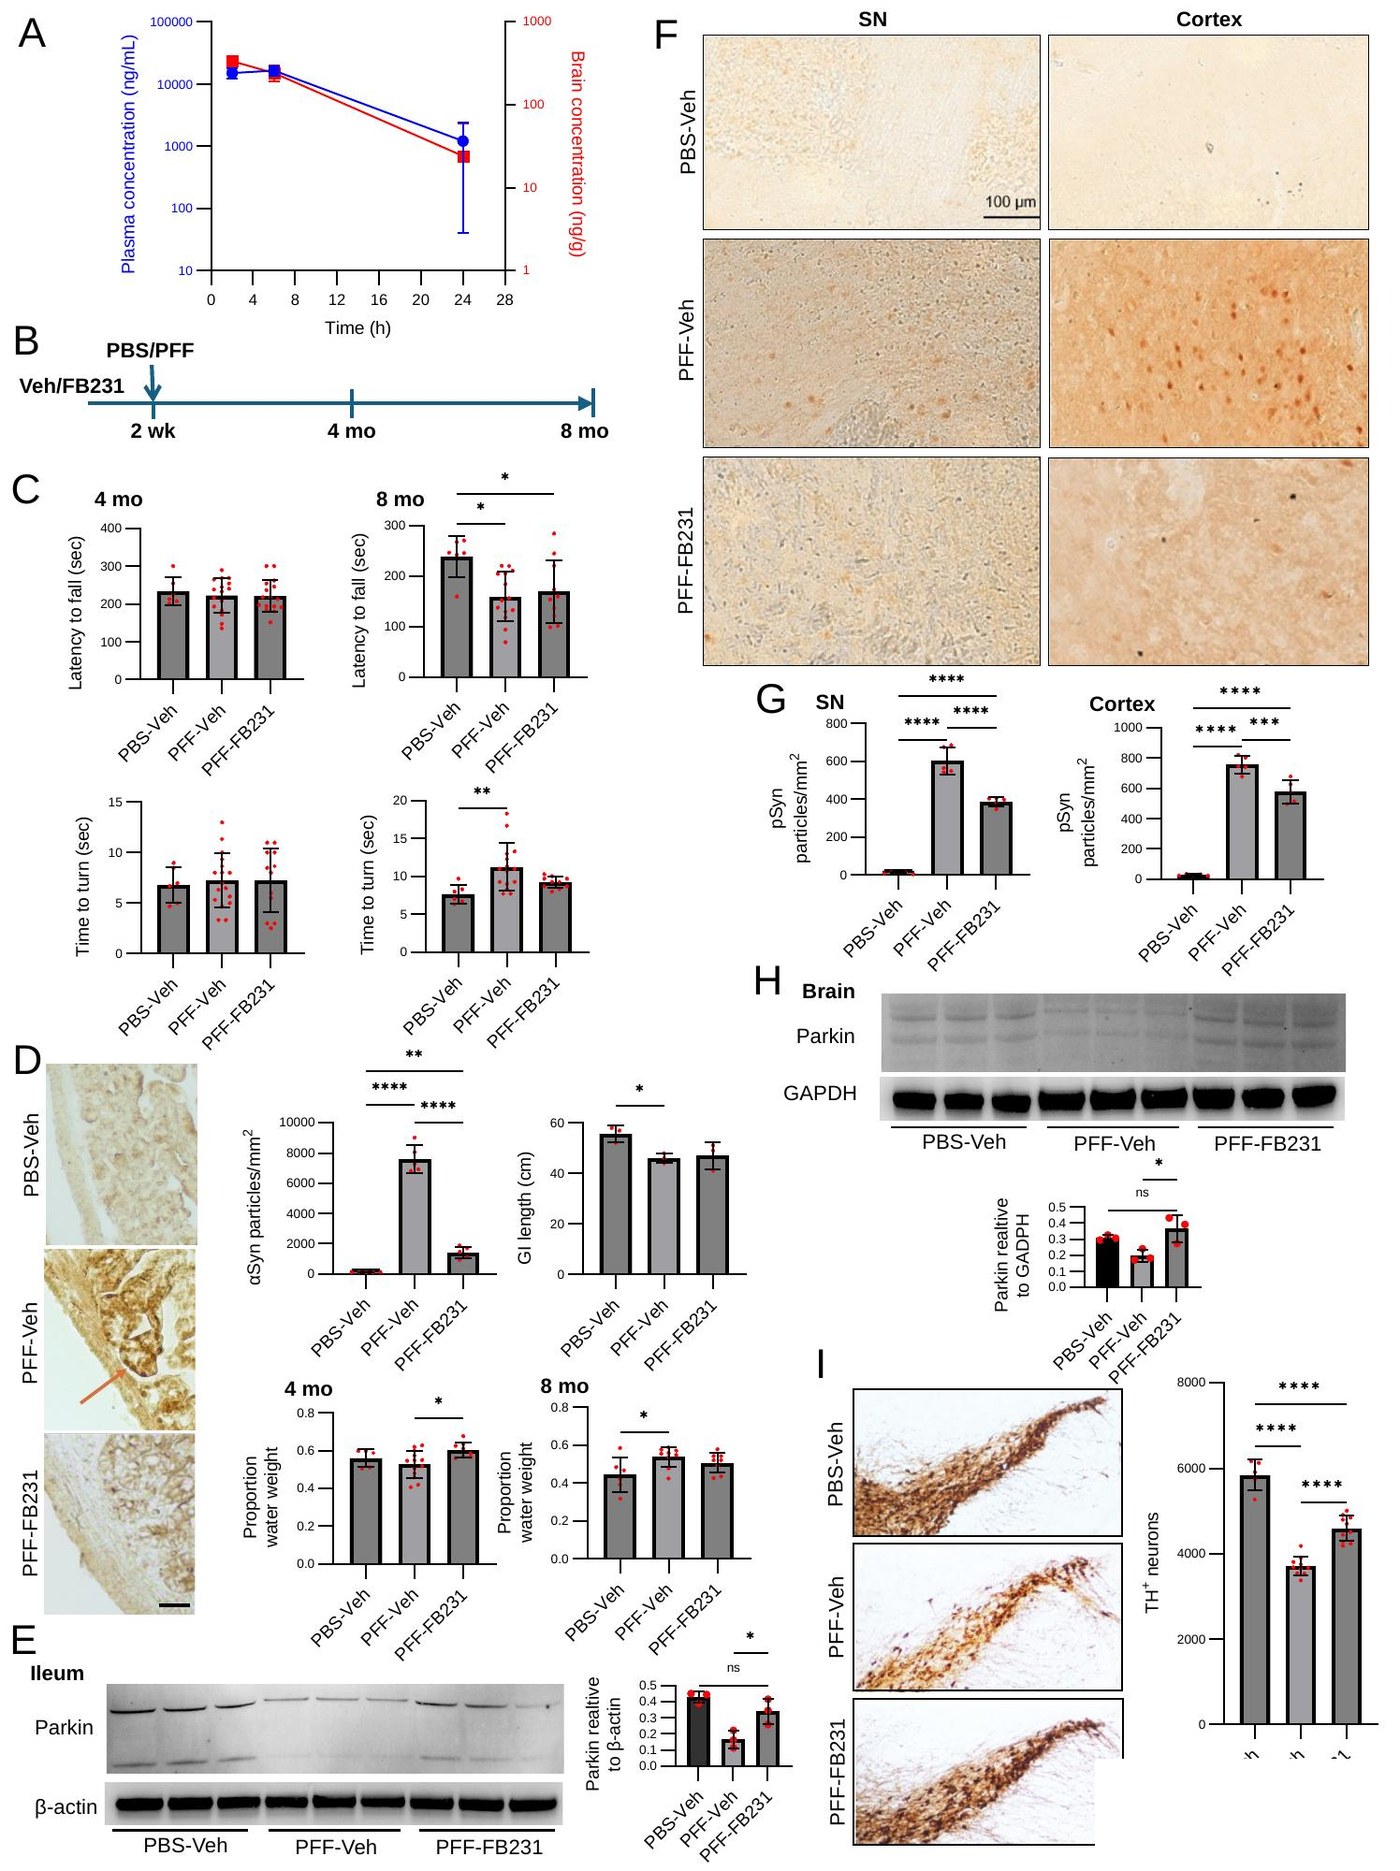
Findings from iPSC neurons were validated in a gut α-synuclein PFF mouse model. FB231 reduced phospho-S129 α-synuclein in substantia nigra and cortex, attenuated dopaminergic neurodegeneration, and partially rescued motor deficits in pole and rotarod tests — closing the loop on the in vitro RNA-seq and biochemistry findings.

Figure 3 - FB231 in a gut alpha-synuclein PFF mouse model
Figure 3 — In vivo FB231 in a gut α-syn PFF model. Brain/plasma PK (a), 8-month study schematic (b), rotarod and pole tests (c). Gut α-syn IHC (d), GI length and faecal-water (d). Ileum and brain Parkin western blots (e, h). Substantia nigra and cortex pSyn IHC and quantification (f–g). Vagal α-syn IHC (i) and TH+ neuron counts.
06

FB231 Rescue in Human iPSC Dopaminergic Neurons

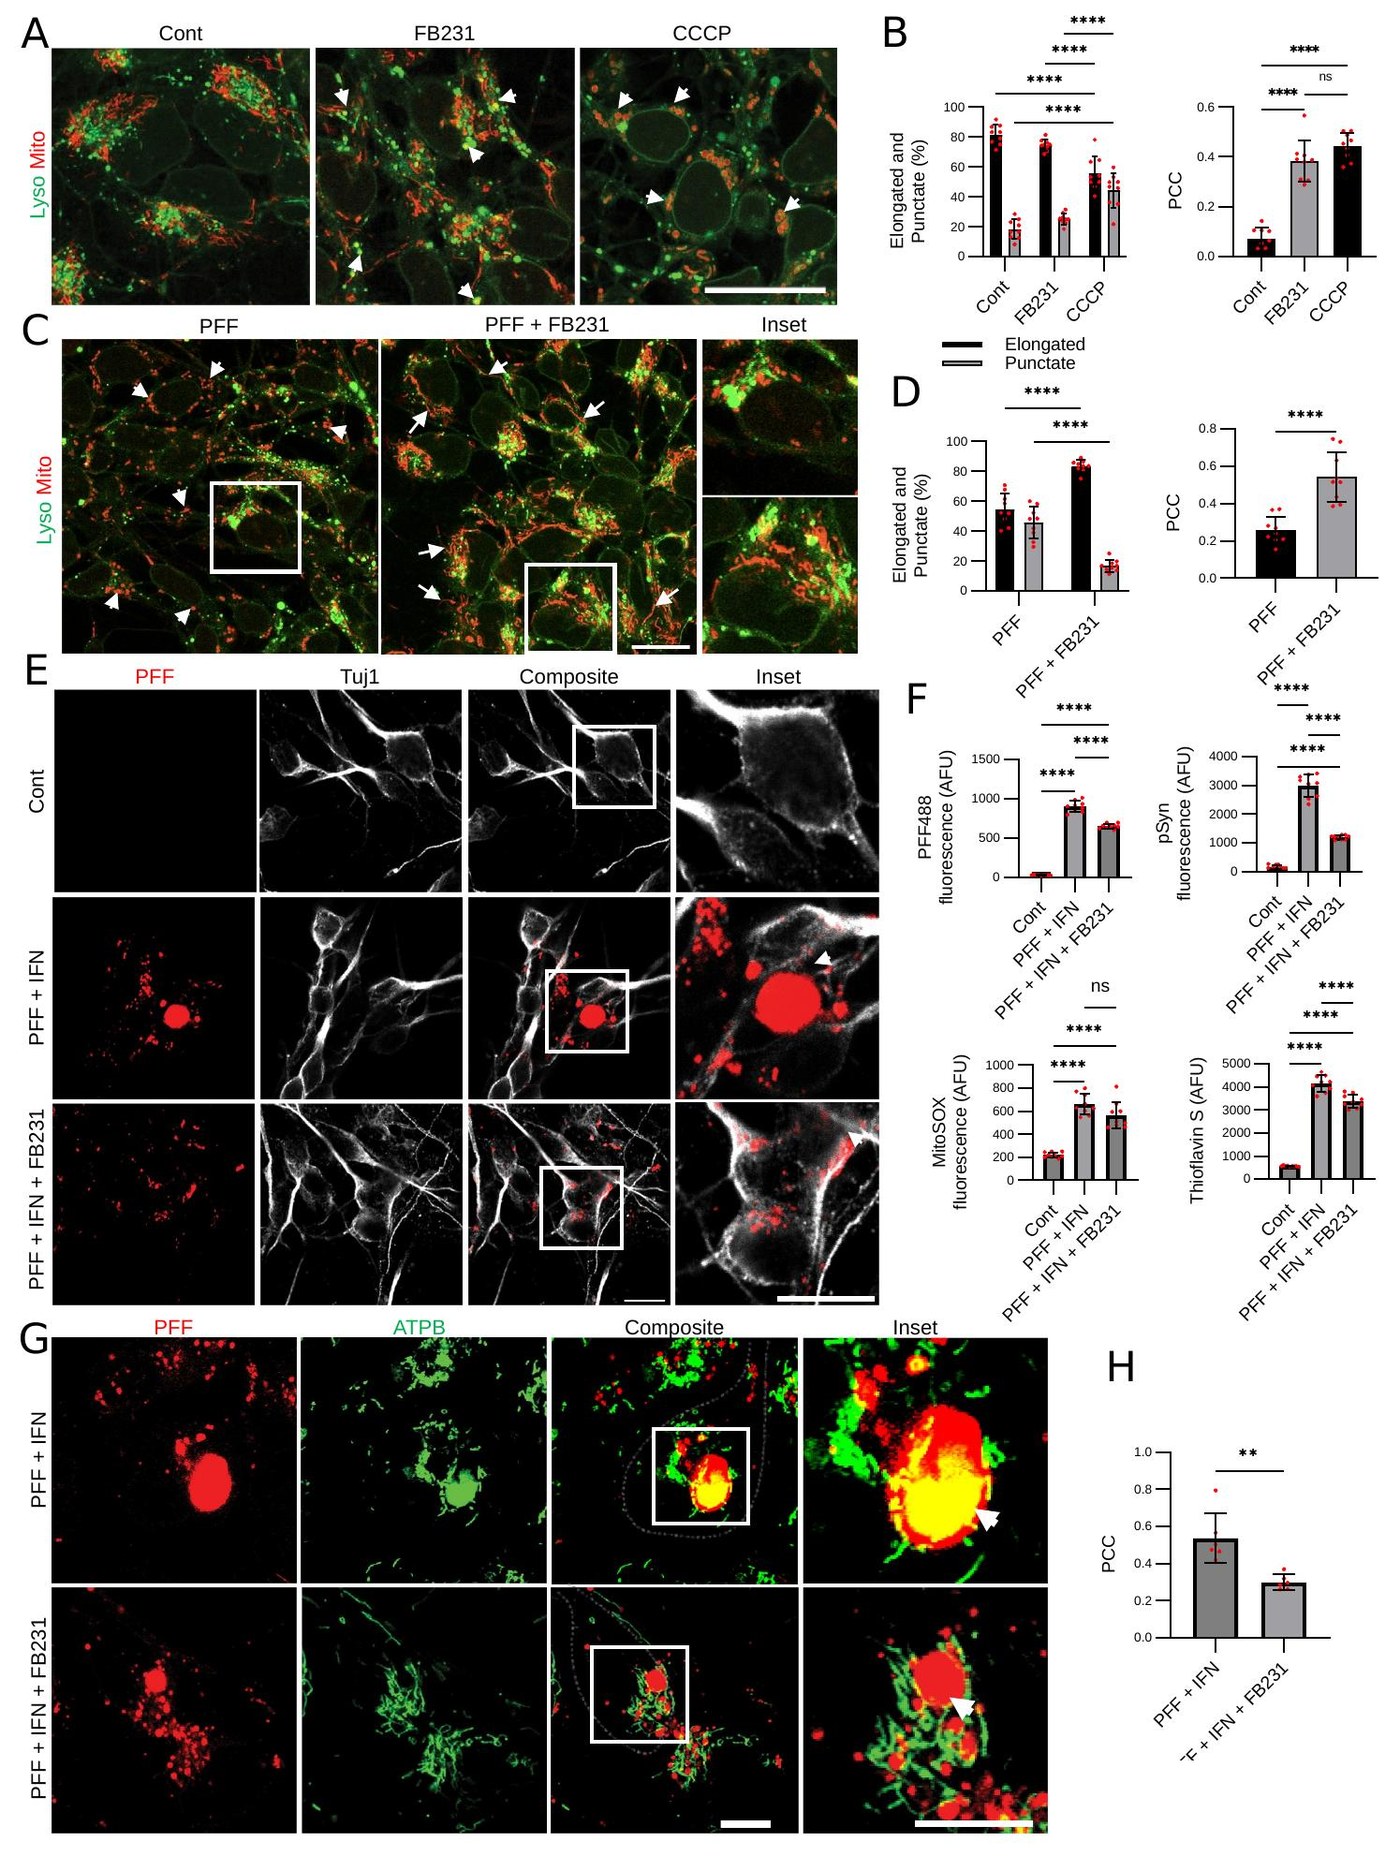
In iPSC-derived dopaminergic neurons exposed to α-synuclein PFFs and IFNγ, the Parkin agonist FB231 restored mitochondrial-lysosomal colocalization, reversed mitochondrial fragmentation, and reduced pSyn / Thioflavin-S aggregates — supporting the path from PARK2 transcriptional defect to a tractable small-molecule therapeutic target.

Figure 4 - FB231 rescue in human iPSC-derived dopaminergic neurons
Figure 4 — FB231 rescue in iPSC DA neurons. Mitochondria/Lyso colocalization (a) and quantification (b) in control vs FB231 vs CCCP. PFF-treated neurons restore colocalization with FB231 (c, d). Triple-channel PFF/Tuj1/composite (e) and quantification of PFF488, pSyn, MitoSOX, and Thioflavin-S fluorescence (f). PFF/ATPB/composite mitochondrial co-localization (g) and PCC quantification (h).
07

Reference

All figures on this page are reproduced from Gong, Bayati, Alban et al., Neural cell state modulation by PARK2 and dopaminergic neuroprotection by small molecule Parkin agonism, bioRxiv 2026, under a CC-BY 4.0 International license. doi.org/10.64898/2026.04.01.715918.

A. Bayati is a co-author. Figures are shown here in their original high-resolution form to illustrate the bulk RNA-seq, scRNA-seq, GSEA, and DecoupleR transcription-factor analyses performed in this study and as a portfolio piece for related iPSC-based disease modeling work.